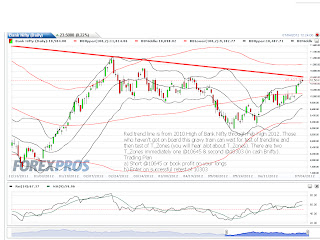
This is a simple chart of Bank Nifty but has not so simple interpretation. To put it very simply, price moves from High volume to Low volume nodes. As you can see we chopped both bulls and bears around 10000 zone and have now reached the volume hole around 10500, after breaking out.
Now its a coincidence that around the 10500-10600 volume hole also has our T_Zone @10635 (I call it twilight Zone Prices..more on the same later) and trend line from 2010 November high.
This will be a good area to book profit on longs or await for a pull back to get back into long positions.
More on individual stocks soon.


No comments:
Post a Comment